We began with a simple question that turned out to be anything but: how many giants share this planet with us, and how are they doing? On some days the work felt like a safari; on others, like a puzzle laid out on a light table. From a small aircraft over Africa and a wind‑worn coast in Alaska, our cameras clicked. Later, in a quiet room, the images became data, and the data became a story.
Why Count
Numbers are the language conservation speaks. Elephant counts chart the pressure of poaching and the pace of habitat change. Sea lion counts tell us whether the ocean’s pantry is stocked. Without credible numbers, we are steering without a compass.
Traditional surveys are heroic but unforgiving: bumpy flights, thin margins for error, and colonies that look like a tangle of driftwood and sun‑warmed rocks. We needed a steadier way to listen to what the images were already trying to say.
The Trick
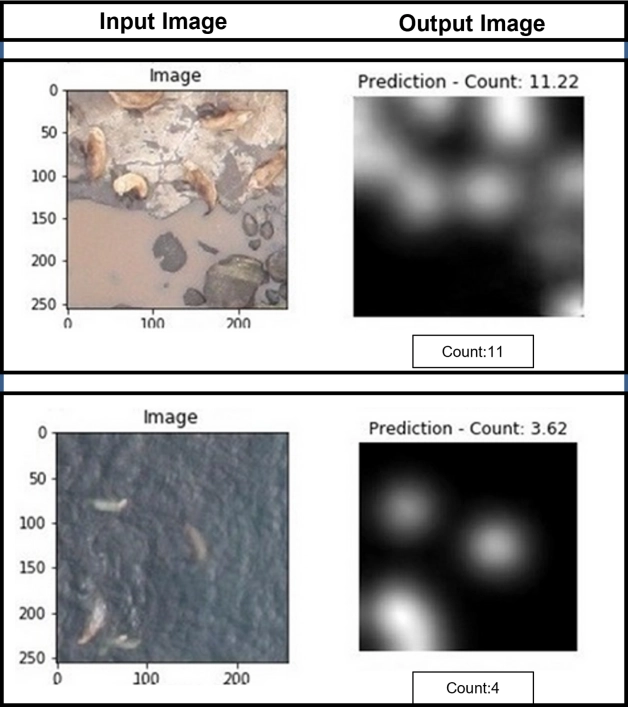
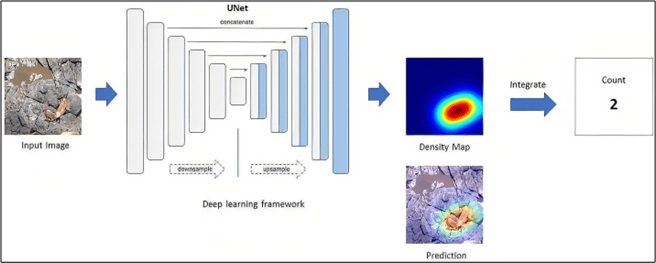
We taught a computer to paint what we call a density map. Each animal marked by a human expert becomes a soft spotlight on the image; the model learns to recreate those spotlights from raw pixels. Add up the light, and you have the number.
For elephants, our training images came from South Africa, Botswana, and Namibia. For Steller sea lions, we learned from carefully annotated rookeries provided by NOAA’s Alaska Fisheries Science Center. A U‑Net‑style network did the heavy lifting; patience and good labels did the rest.
What We Found
On elephants, the model’s error hovered around an RMSE of 0.60 — close enough to feel like we were standing right there. On Steller sea lions, where overlap and spray complicate everything, we reached an RMSE of 1.88. The remarkable part wasn’t a single number; it was the rhythm. Once trained, the model reads thousands of images with the same calm attention, frame after frame.
Measure carefully, then act with confidence. Better counts lead to better decisions.
Epilogue — Why It Matters
Good numbers don’t end debates, but they sharpen them. They set patrols in motion, redraw lines on maps, and nudge budgets toward what works. And the recipe we used — aerial images plus density maps — travels well. Swap elephants for penguins or sea lions for whales, and the method still holds.
Paper and Credits
Chirag Padubidri, Andreas Kamilaris, Savvas Karatsiolis, Jacob Hamminga
“Counting Sea Lions and Elephants from Aerial Photography using Deep Learning with Density Maps,” Animal Biotelemetry, 9(27), August 2021. DOI: 10.1186/s40317-021-00247-x
Elephant imagery: South Africa, Botswana, Namibia. Sea lion imagery: NOAA Fisheries Alaska Fisheries Science Center.